
Blogger Question: “My blog traffic is down! I don't know why or what to do!”
Since Google Reader went to the Google Graveyard on July 2, I've seen people comment that they think it's the reason their blog traffic is down. There's an easy way to get a better idea of why your blog traffic goes up and down, and it has to do with Traffic Sources. I thought I'd share the easy, step-by-step way to see how to figure out where your traffic is coming from so you can pinpoint where there are losses or gains.
Assumptions: In this tutorial, I'm assuming you have Google Analytics installed on your blog. If you don't, it's a free and easy way to get all your website statistics. Here are some tutorials: WordPress self-hosted; Blogger; Tumblr. Google Analytics cannot be used on WordPress.com blogs at this time.
Step 1: From your Google Analytics homepage, and navigate to “Traffic Sources.” It's on the left hand side of the screen – you may need to scroll down some to see it, depending on your screen resolution.

Step 2: Expand the “Traffic Sources” options by clicking “Traffic Sources.” You can then further drill down to more options under each item with a bullet beside it:

Step 3: For an overview of all your traffic sources, you'll navigate Traffic Sources > Sources > All Traffic. I most frequently use this All Traffic view.

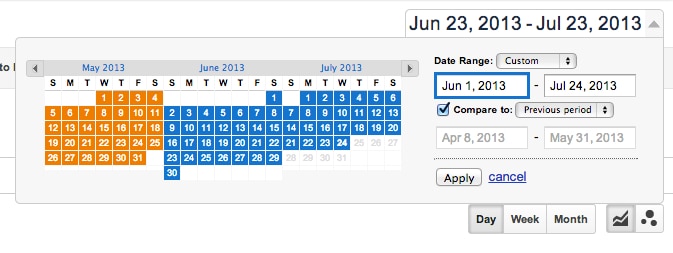
Step 4: For the purposes of this tutorial, we're trying to find sources of change over time, so we need to set our date range. You find the date range at the top right of your screen. You need to set the current range, and then check the “Compare to” box to pick a previous period. So if you're looking for summer traffic versus spring traffic, you can select dates that represent those time periods. Click “Apply” and your data will update below.

Step 5: Look at the good stuff! Scroll down the page to see all your sources and the variance in traffic over the time periods you selected.
 1. These are the key traffic metrics. For most people, visits concentrated on, but you should also pay attention to any spikes in the other categories. Perhaps people stop staying on your site as long, or your new visitors jumps sharply – those are things you can look at so you know what blog tweaks (or thank you's!) you need to make
2. This is the source. By default, they're listed from most to fewest visits. “Direct” means someone typed in your website directly, OR the source couldn't be specified/tracked. This is a tricky one because it's a catch-all for anything that couldn't be tracked. It will usually be your #1 source.
3. This is the percent of change over the specified time period. This is where your answer will lie as far as where your traffic changes are coming from. You'll notice my direct visits jumped over 35% while my Google organic searches dropped over 11%. Perhaps I did more offline connecting in the current period that made people know exactly where my blog is without having to search for it. For Google organic, I would want to explore that further by navigating to “Traffic Sources > Search > Organic” and seeing how the different search terms have changed over time.
Step 6: Search for more specific answers. Use the search box to find a specific traffic source. For this example, I'm looking to see if my traffic has increased from Bloglovin (a Google Reader alternative) in recent weeks:
 As you can see from the graph, Bloglovin traffic jumped roughly around the same time Google Reader died. You could assume this is from people switching from Google Reader to Bloglovin.'
Once you get the hang of knowing where to go in Google Analytics and specifying your date ranges, the data won't look as intimidating as it might have before. Dig in more under Traffic Sources and then Referrals to see where people might be linking to you from: bloggers, news sources, message boards – it's all really interesting (to me at least)!


